




A dashboard that makes your business performance visible
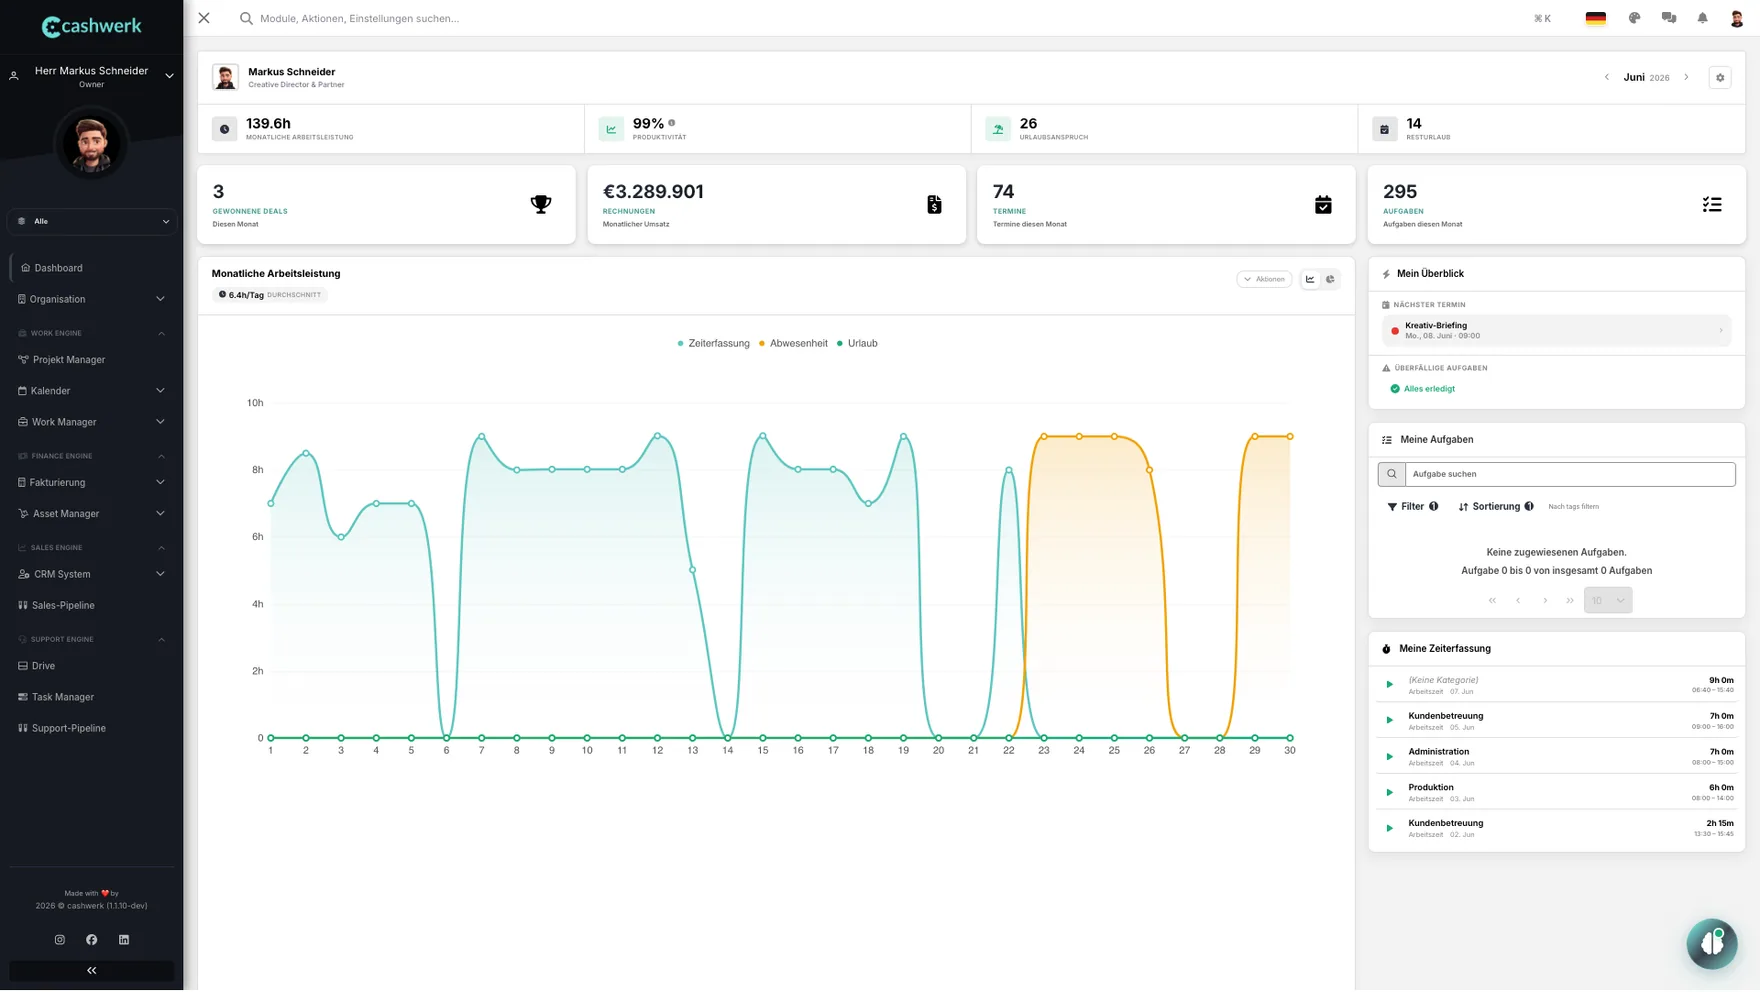
The cashwerk dashboard is not a static page with decorative charts. It is the central entry point that shows in seconds how your business is doing—with data from every module.
In many companies the day starts by opening five different tools: CRM for pipeline status, spreadsheets for revenue, a time app for team utilization, and project software for open tasks. The cashwerk dashboard consolidates all of this in one place. Without manual entry, you see current working hours, absence days, vacation balance, and average hours per day.
Monthly performance appears as line or doughnut charts so you can spot trends immediately. The “My tasks” widget lists open to-dos with due dates, while recent time entries give a quick view of how work is distributed. For owners and leads, CRM metrics show contact and company KPIs with conversion rates, and the project dashboard reports progress across active projects.
What sets the cashwerk dashboard apart from static reporting tools are quick actions. Instead of navigating to each module, you start frequent tasks from the dashboard: create an invoice, add a contact, start a project, create an appointment, or start time tracking. Quick actions save clicks on routine work every day.
Global search (Cmd+K / Ctrl+K) complements the dashboard as a universal entry point. Search jumps to modules, runs actions, changes settings, or opens help—without leaving the screen. Together with the AI assistant CASPER, which answers natural-language questions and searches business data semantically, the dashboard becomes the cockpit for running your company.